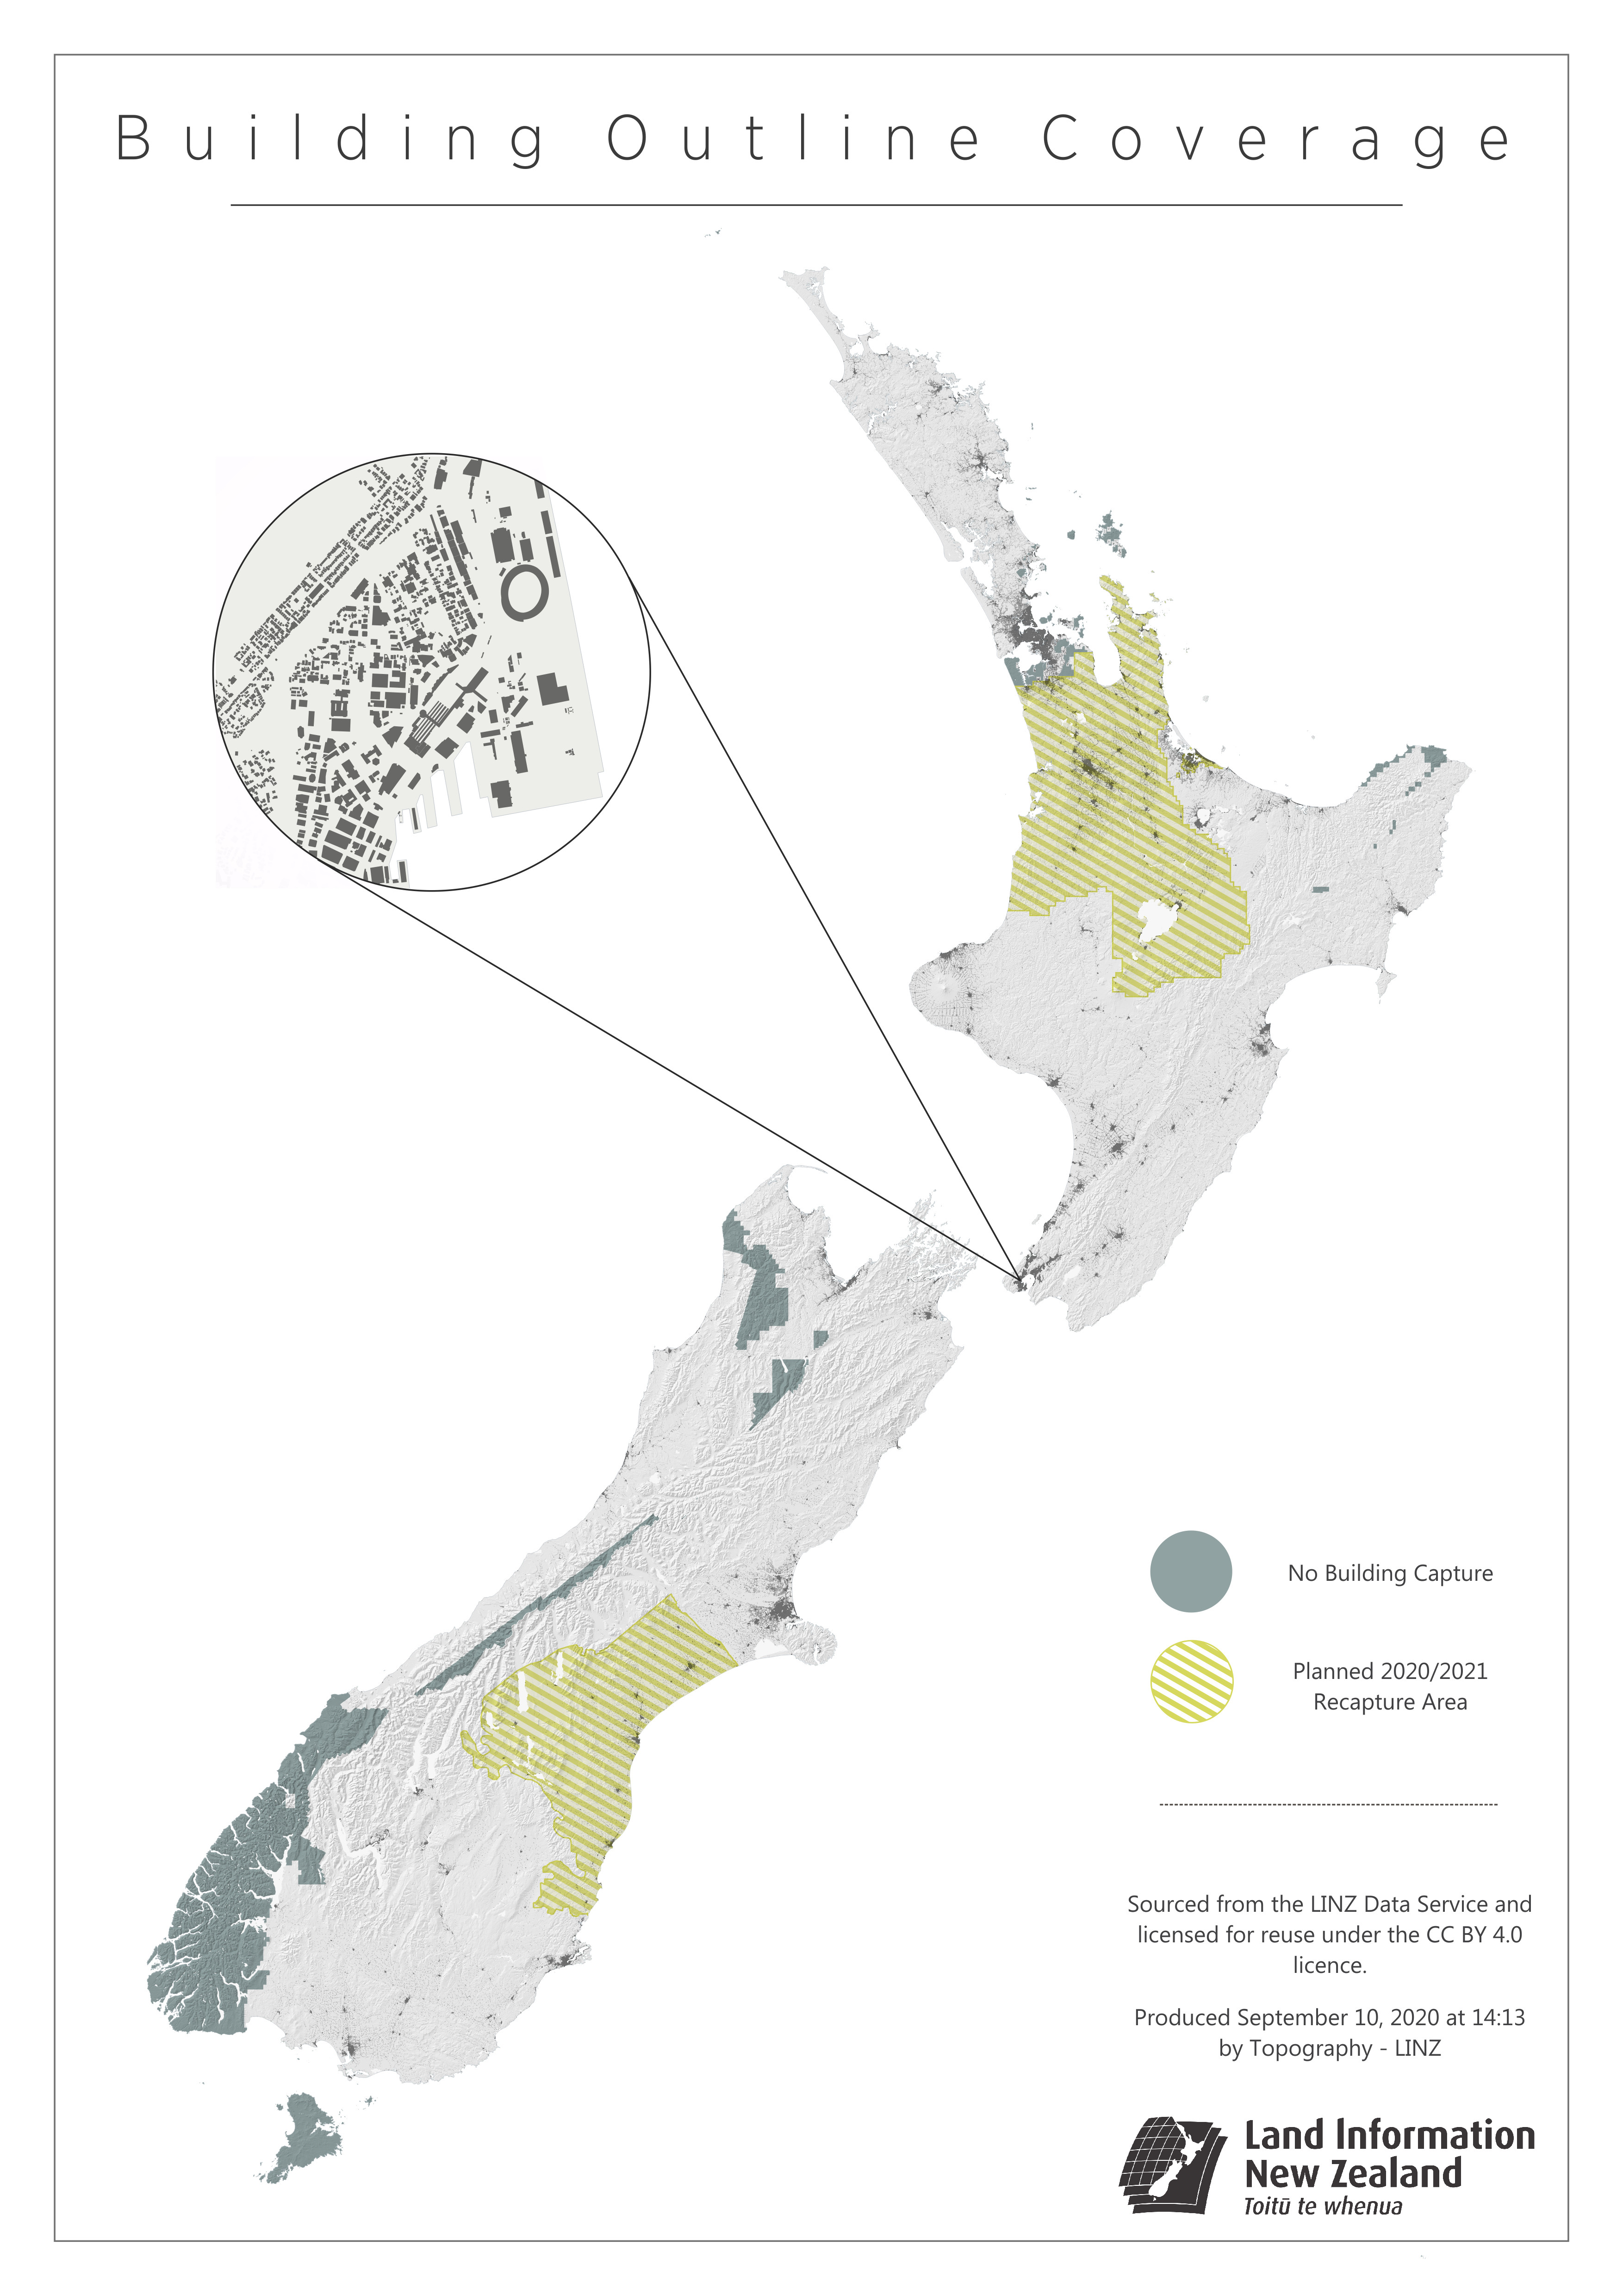
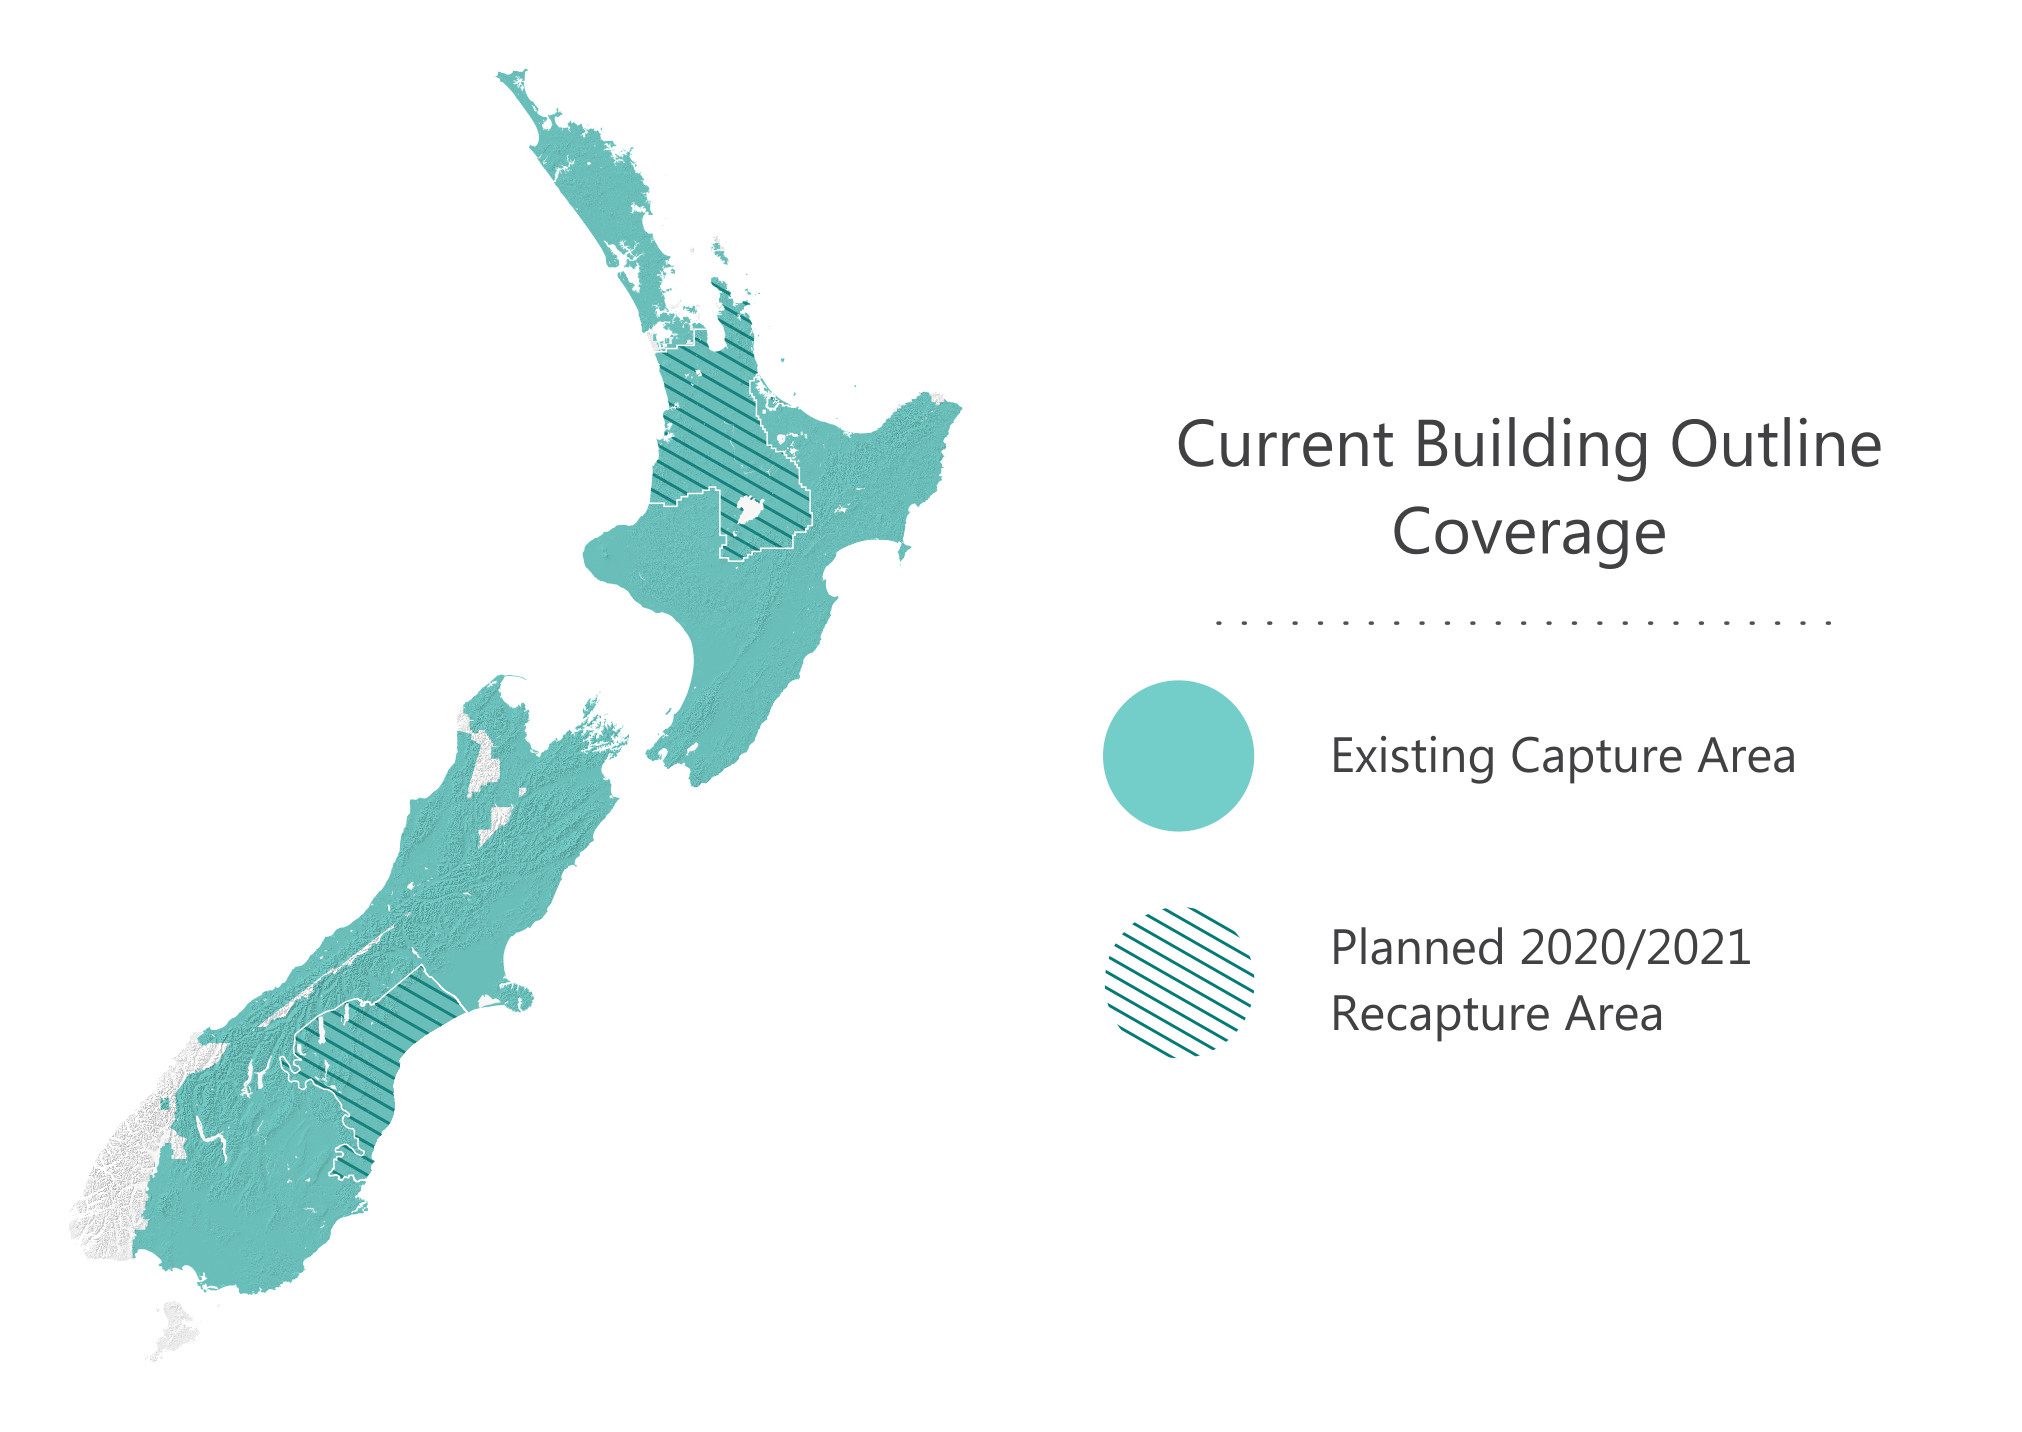
Building Outlines Coverage
An internal map created to highlight the current building outlines dataset coverage. The second image is used in a monthly report to show a quick update, this is far more engaging and easy to read then a text based report. I also prefer the use of colour to show where data occurs which is not as intuitive in the first map.